Based on how we’ve put together this book, we may have given you the idea that we’ve put our methods into practice in an utterly linear and structured way. This would be giving you the wrong impression.
In reality, the CUTGroup is just one of many programs we have going at any given time. As you can see from the Acknowledgements, we’ve worked with dozens of experts giving us bits of advice and helping us figure out what we’re doing.
The best way we can show you how we got to where we are is to directly show you how our methods met practice. We cover each of the tests we’ve done below and talk briefly about the impact each had on our methods.
For each of the examples, we have a complete set of results published on the Smart Chicago website. This includes links to every piece of communication we’ve sent to testers, details on all test objectives, and the raw results of every test.
#1 FreedomPop Router
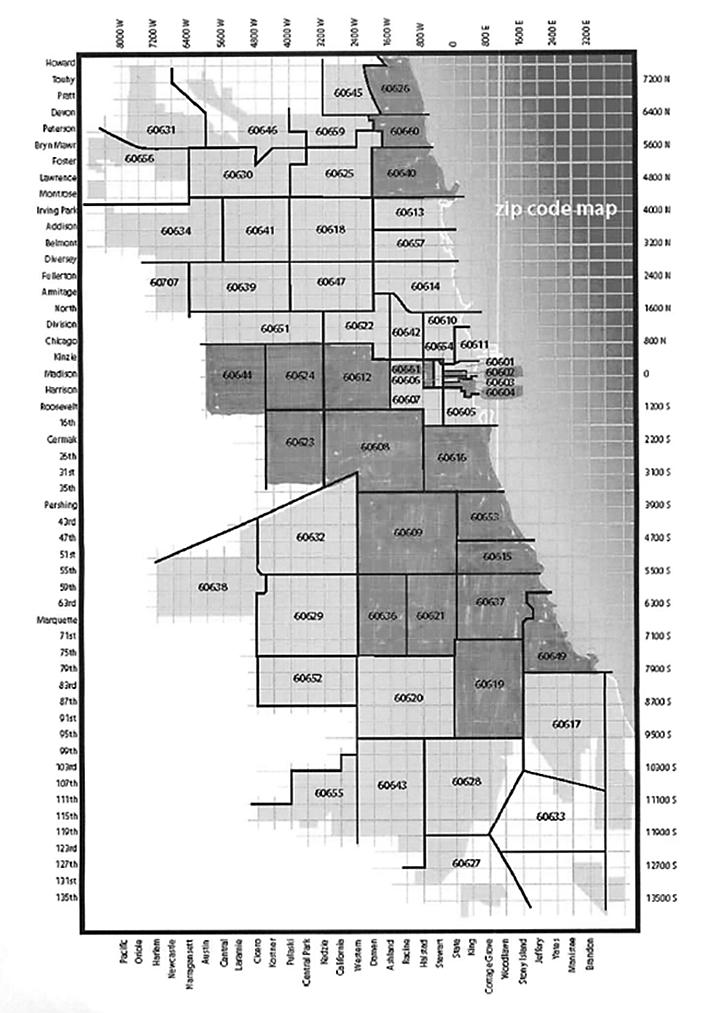
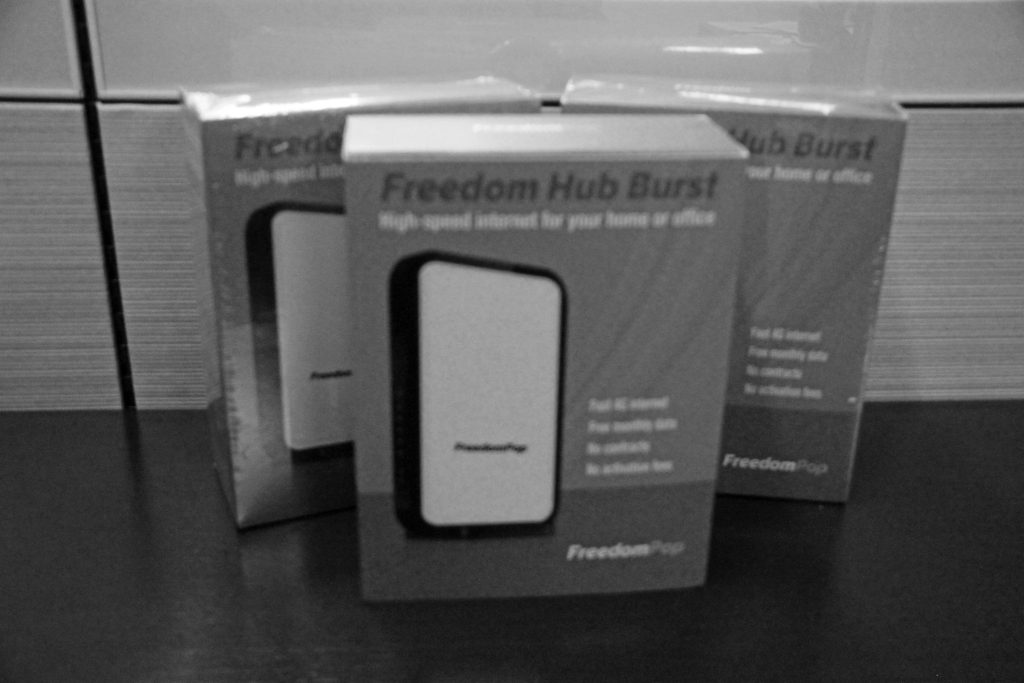
The first test we ever did was also the one that was least like the others. We spent two months recruiting testers, and we were ready for our first test. By this time, the City of Chicago was looking to launch a pilot with FreedomPop, but they weren’t sure if the 4G routers they offered would be of acceptable quality. Since expanding access to the Internet is one of the core missions of Smart Chicago, we decided to come up with a process to use the CUTGroup to test the hardware, customer workflow, and coverage for this product.
Segmenting was important in this test, because the product was only available at this price in certain ZIP codes of the city. At the end of March and beginning of April 2013, two emails were sent to CUTGroup members in the twenty ZIP codes where the lowest-cost EveryoneOn option was available.
We had 94 possible testers, and 8 people signed up for the test through what would soon become our standard process for recruiting and segmenting. Testers indicated that unboxing the device was a breeze and that it worked well. We were able to determine that the service met expectations by engaging with people over email, home delivery, and a web form. The system worked, but we knew we had to get people together in a room to start delivering on the promise of community engagement.
References
- Escarra, Emily. (2013, July 26). Results of CUTGroup001: FreedomPop Router Test. Retrieved from http://www.smartchicagocollaborative.org/results-of- cutgroup001-freedompop-router-test/
- Mayor’s Press Office. (2013, April 16). Mayor Emanuel Announces New Campaign to Expand Affordable Internet Options for More than 1 Million Chicagoans, Retrieved from http://www.cityofchicago.org/city/en/depts/mayor/ press_room/press_releases/2013/april_2013/mayor_emanuel_announcesnewcam- paigntoexpandaffordableinternetopti.html
#2 – Go to School! User Application Test
This test centered around a website that promised “Four steps get to your CPS school on time.” It is a simple wayfinding tool with school start times and contact information baked in. We learned two things from our first in-person test: how to segment users for a complex requirement and the power of the “shared screen” in community engagement.
We had to do a significant amount of segmenting of our list of 368 CUTGroup members. We asked all of them two questions:
- Are you responsible for taking one or more children to a Chicago public school this fall?
- Are you available for testing on either May 28 or May 30?
There were 28 people who responded to these requirements. Based on the locations of these people, we decided to hold tests at two libraries: the Kelly Library in the Englewood neighborhood on Tuesday, May 28th, and at the Uptown Library in the Chicago Uptown neighborhood on Thursday, May 30th. There were 14 people who expressed interested in each location, so it worked it really well.
The testers were spot-on knowledgable about the topic of getting kids to school on time. In an effort to maintain privacy and to provide the widest pos- sible utility of our testing to civic developers everywhere, we developed some shorthand “personas” that helped in identifying their stance vis-a-vis the app.
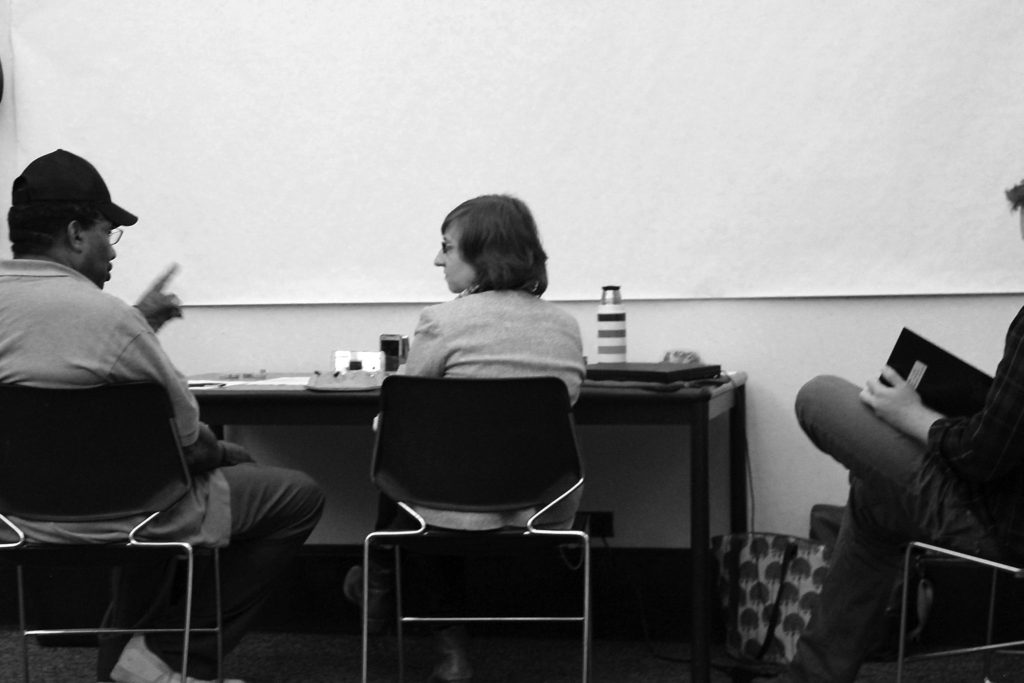
This was the first time I personally came into contact with the idea that the CUTGroup was a great framework for discussing difficult topics in unemo- tional and (hopefully, ultimately) helpful ways. I proctored “Tester #2: Father responsible for three children (17, 16, and 10) Samsung Galaxy Kelly Library, Englewood.” The topic of school closings and “safe passage” was very active and contentious. But in the context of reviewing this site, he was able to express in everyday terms the choices he made in terms of danger associated with certain routes.
This is the joy and the promise of the CUTGroup. We end up using a “shared screen”—a concrete, tangible interface that everyone can point to, and talk about—to serve as a common ground for discussion of difficult topics that can affect policy.
On a more prosaic note, we were able to uncover trouble with the custom time/date picker screen. People didn’t understand how to work it. The developer, Tom Kompare, made changes to the picker based on the feedback.
References
- O’Neil, Daniel X. (2013, August 13). Results of CUTGroup002: Go2School
User Application Test. Retrieved from http://www.smartchicagocollaborative.org/ results-of-cutgroup002-go2school-user-application-test/ - Connect Chicago. (n.d.). Kelly Library. Retrieved from http://locations.weconnectchicago.org/location/kelly-library-6151-s-normal-boulevard
- Connect Chicago. (n.d.). Uptown Library. Retrieved from http://locations.weconnectchicago.org/location/uptown-library-929-w-buena-avenue
- O’Neil, Daniel X. (2013, July 21). CUTGroup #2, Tester #2 Father responsible for three children (17, 16, and 10) Samsung Galaxy Kelly Library, Englewood. Retrieved from http://vimeo.com/70725523
- Go To School! (n.d.) Retrieved from http://cps.go2school.org/
- O’Neil, Daniel X. (2013, August 12). Go2School Screen 2/4 — Date and Time Picker. Retrieved from https://www.flickr.com/photos/juggernautco/9495316852/
- Kompare, Tom. (n.d.) @tomcompare. Retrieved from https://twitter.com/ tomkompare
- O’Neil, Daniel X. (2013, July 7). News story: Finding ‘real people’ to test civic apps. Retrieved from http://www.danielxoneil.com/2013/07/07/news-story-finding- real-people-to-test-civic-apps/
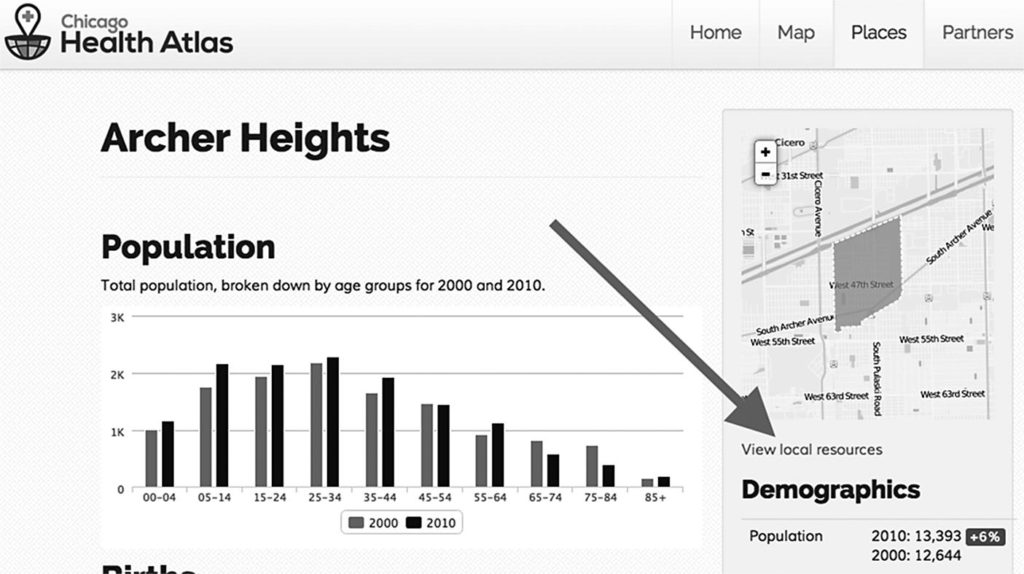
#3 – Chicago Health Atlas
The Chicago Health Atlas is a place where you can view citywide information about health trends and take action near you to improve your own health. The test took place at the Erie Family Health Center, a Smart Health Center in Humboldt Park.
We wanted to see how everyday residents were using it and make sure that people could find what they were looking for on the site.
The test revealed a number of user interface issues, mostly revolving around a key feature: the ability to see healthcare resources near the user. We made some simple modifications to the site, mainly making text bigger, explaining the features more clearly, and showing links to resources as users were viewing the map. We’ve yet to re-test the site, but informal testing (watching people view the site) indicates that we’ve improved clarity.
References
- Whitaker, Christopher. (2013, August 6). CUTGroup Test #3: Chicago Health Atlas. Retrieved from http://www.smartchicagocollaborative.org/cutgroup-test- 3-chicago-health-atlas/
- Smart Chicago. (n.d.). Smart Health Centers. Retrieved from http://www.smartchicagocollaborative.org/projects/smart-health-centers/
- Chicago Health Atlas. (n.d.) Retrieved from http://chicagohealthatlas.org/
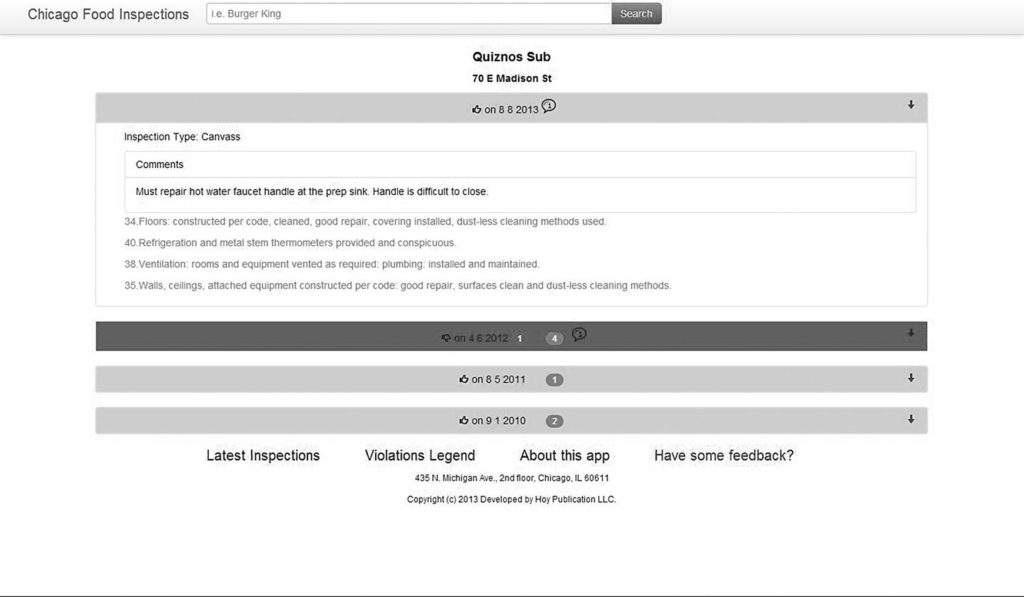
#4 – EatSafe.co
Our fourth session was focused on EatSafe.co, a website that shows details of food inspections near you, which was developed by Hoy Publications. This in-person test took place at the Chicago Public Library’s Hall Branch at 4801 S. Michigan Ave in the Grand Boulevard neighborhood.
This was one of the more community-focused tests. We had overbooked the sessions, and lots of people showed up early. It was touchy for a while because we were struggling to match up proctors to testers. After we loosened up and accepted the fact that we had to double- and triple-up testers to proctors, people really enjoyed working together and talking about the website. Here’s what Hoy Managing Editor Fernando Diaz had to say:
“Partnering with the CUTGroup was the most effective research experience I’ve ever been a part of. We met real Chicagoans who were generous with their time and feedback. And among the highlights is that we have all of the results for further evaluation and incorporation into future iterations of our project.”
We got good, actionable feedback from testers. When clicking a violation, testers wanted an explanation of the violation. (The current function was that they were directed to a list of establishments with the same violation.) Testers were also interested in better explanations of the inspection results.
We had one particularly remarkable experience worth relaying, because it shows how civic apps fit into the real lives of residents. The tester was the mother of a child in a public school near her home. While browsing restau- rants, she saw that her child’s school had failed an inspection.
She said: “I didn’t hear anything about it. I didn’t know.” You could hear the frustration, and associate with it. We’ve all been in situations where a lack of information takes us aback, makes us feel powerless. She read the text of the violation, relating to washing facilities. “That’s not good. That’s not a good look at all,” she said.
I asked her what she wanted to do next, asking a classic UX testing nudge, drawing the tester back to the interface. She wanted to “contact the school, and find out what’s going on, because my son is eating lunch there.” There was no way to contact the school from the website.
References
- Marziano, Sonja. (2013, November 21). CUTGroup Test #4: EatSafe.co. Retrieved from http://www.smartchicagocollaborative.org/cutgroup-test-4-eatsafe-co/
- Hoy Publications LLC. (n.d.). Chicago Food Inspections. Retrieved from http://www.eatsafe.co/
- City of Chicago. (2011). Food Inspections. Retrieved from https://data.cityofchicago. org/Health-Human-Services/Food-Inspections/4ijn-s7e5
- Vivelohoy. (2014). Retrieved from http://www.vivelohoy.com/
- Smart Chicago. (2013, December 26). CUTGroup 4 Eastsafe Tester 16. Retrieved from https://www.youtube.com/watch?v=Sk_j7xppUtg#t=14
- Smart Chicago. (n.d.). Make $20 at an in-person test of a food inspection website. Retrieved from http://us5.campaign-archive2.com/?u=085247dea37361c- 266002462c&id=63604c0cf7&e=[UNIQID
- CUTGroup Test: Food Inspection Website. (n.d.) Retrieved from https://smartchicago2012.wufoo.com/forms/cutgroup-test-food-inspection-website/
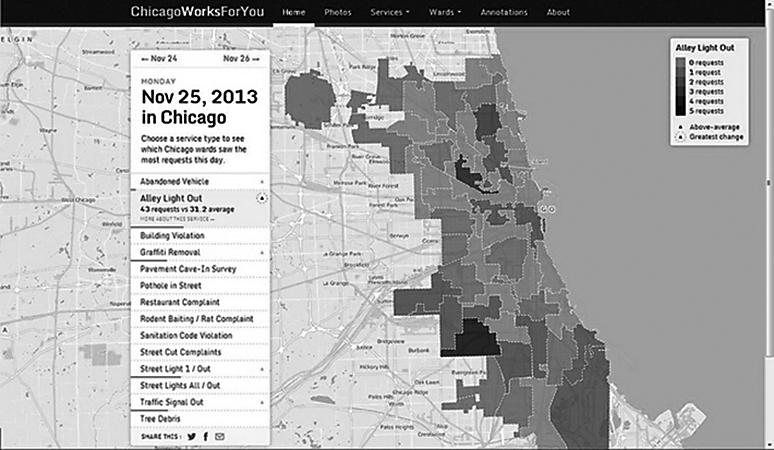
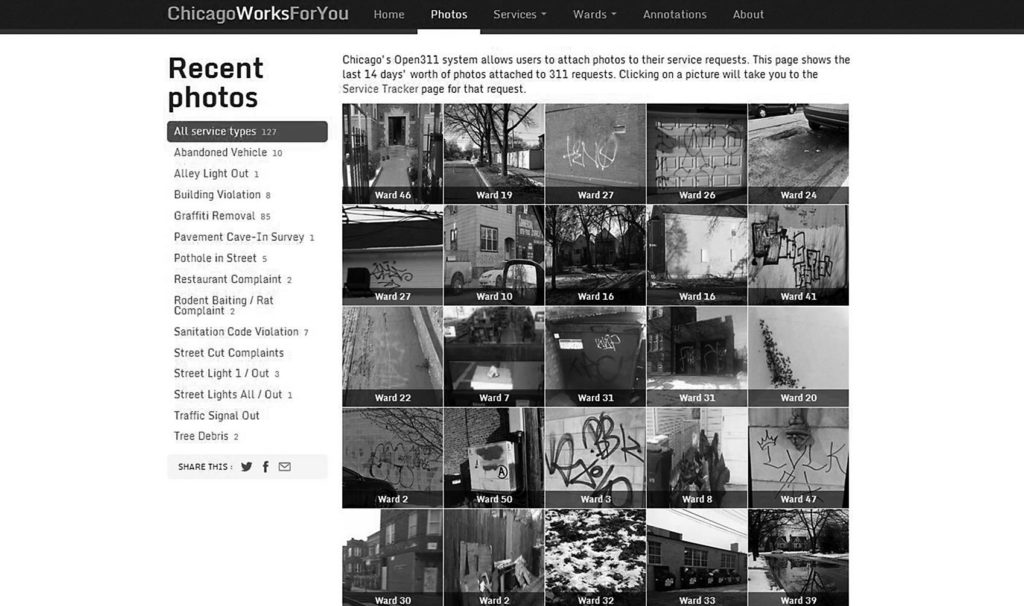
#5 – ChicagoWorksforYou.com
Our first remote test was for ChicagoWorksforYou.com, a Smart Chicago project. ChicagoWorksforYou provides citywide information about city service requests. Users are able to get a ward-by-ward view of service delivery in Chi- cago, learn about the top service requests made on a given day, view photos of requests, and learn more about the process of submitting service requests.
We did this test remotely because we wanted to get as many people as pos- sible, mainly because we were in a bind—we had to dispense gift cards that were about to expire, and the Thanksgiving holiday was coming up. But we also had a theory that the CUTGroup could serve as a form of advertising and marketing for a website and thereby increase the user base.
We started by sending out an email to all 565 CUTGroup participants, asking them if they would be available to provide feedback through a remote test. We received 116 responses in one day and asked 90 random respondents to do the test.
We asked more “yes” or “no” questions than we usually do, in order to gather quantitative results. We leavened this with open-ended questions to
see what users were interested in when visiting the site, and finally we asked users to click on specific links of the website, and discuss their experience. We were pleasantly surprised at the thoroughness of testers’ responses without a proctor being present.
In addition, we asked 5 willing testers to do a test via screen share. We randomly chose our respondents, compiling a group of testers from all areas of Chicago, and had a variety of responses to our questions. Due to technical problems, we were unable to do the screen share. We should have tested it more and provided more technical instructions on how to screen share. The other issue was more conceptual: Can we do the same kind of community engagement in a remote test, over a shared video connection, that we can do in a public computer center? We’re going to look into this more.
We promise in our release form that, “In any report we might publish, we will not include any information that will identify you.” So in order to keep track of testers, we ask them to provide a “tester profile”, which we describe as “a short phrase that describes yourself and/or your relationship to the software.” People have fun with the tester profiles.
Here are a couple of responses we heard from our testers specifically about the remote test:
- “An online test is a better form of testing a website or app. It is done within the comfort of one’s home, with flexible times. It allows more people to participate and allows for a more natural environment.” –Tester #77, Elizabeth07
- “I do like the remote survey better than the one I had to go to the library for. The particular public library I had to go to was in a very dangerous area and I didn’t know before I went… Other than that it has been a pretty good experience being a part of the CUTGroup thus far and I’m definitely willing to give my input on multiple websites.” Tester #46, 3rd Year Student
Here’s the complete text of our release form.
Cutgroup Consent To Participate In Usability Test
What is the purpose of this test?
We are asking you to participate in a usability test because we are trying to learn more about how people are likely to use the website you are being asked to test.
How much time will this take?
This study will take about 30 minutes of your time as follows: 5 minutes of discussion, 25 minutes for evaluating the site and 5 minutes of wrap-up.
What will I be asked to do if I agree to participate in this study?
If you agree to be in this study, you will be asked to perform basic interac- tions with the application under consideration.
The test session will be video recorded. Following the session, the video recordings may be analyzed by the CUTGroup in order to provide further feedback, and videos with voice and the website interface may be shared to educate others about website usability.
42 The CUTGroup
What are the risks involved in participating in this study?
Being in this study does not involve any risks other than what you would encounter in daily life interacting with a computer-based application. It is important that you understand that your information will remain confiden- tial during and after the testing session.
What are the benefits of my participation in this study?
You will not personally benefit from being in this study beyond the basic remuneration that has been offered. However, we hope that what we learn will help contribute to improving the quality of the applications being studied.
Can I decide not to participate? If so, are there other options?
Yes, you can choose not to participate. Even if you agree to be in the study now, you can change your mind later and leave the study. There will be no negative consequences if you decide not to participate or change your mind later.
How will the confidentiality of the research records be protected?
The records of this study will be kept confidential. In any report we might publish, we will not include any information that will identify you. Study records will be stored securely and only the CUTGroup will have access to the records that identify you by name. Some people might review our re- cords in order to make sure we are doing what we are supposed to. If they look at our records, they will keep your information confidential. Digital versions of all video recordings will be kept in password-protected files and will be destroyed within three years after start of the study.
Whom can I contact for more information?
CUTGroup: 312.565.2867
You will be given a copy of this information to keep for your records.
Statement of Consent:
I have read the above information. I have had all my questions answered. (Check one:)
I consent to be in this study. I DO NOT consent to be in this study. Signature: _______________________________ Date: ______________ Printed name: __________________________________________________
Examples 43
Personal Release for Filming:
I authorize the CUTGroup to take and use video recordings of me in connection with the usability study.
Signature: _______________________________ Date: ______________ Printed name: __________________________________________________
References
- Marziano, Sonja. (2013, November 25). CUTGroup #5: ChicagoWorksForYou. com. Retrieved from http://www.smartchicagocollaborative.org/cutgroup-5-chica- goworksforyou-com/
- Chicago Works for You. (n.d.). Retrieved from http://chicagoworksforyou.com/
- City of Chicago. (n.d.). Open311 API Documentation. Retrieved from http://dev. cityofchicago.org/docs/api
- Smart Chicago. (n.d.). Make $20 at a remote test of a city service delivery Web site. Retrieved from http://us5.campaign-archive1.com/?u=085247dea37361c- 266002462c&id=3937c108a4&e=[UNIQID]
- The Chicago Boundary Service. (n.d.). Retrieved from http://boundaries. tribapps.com/
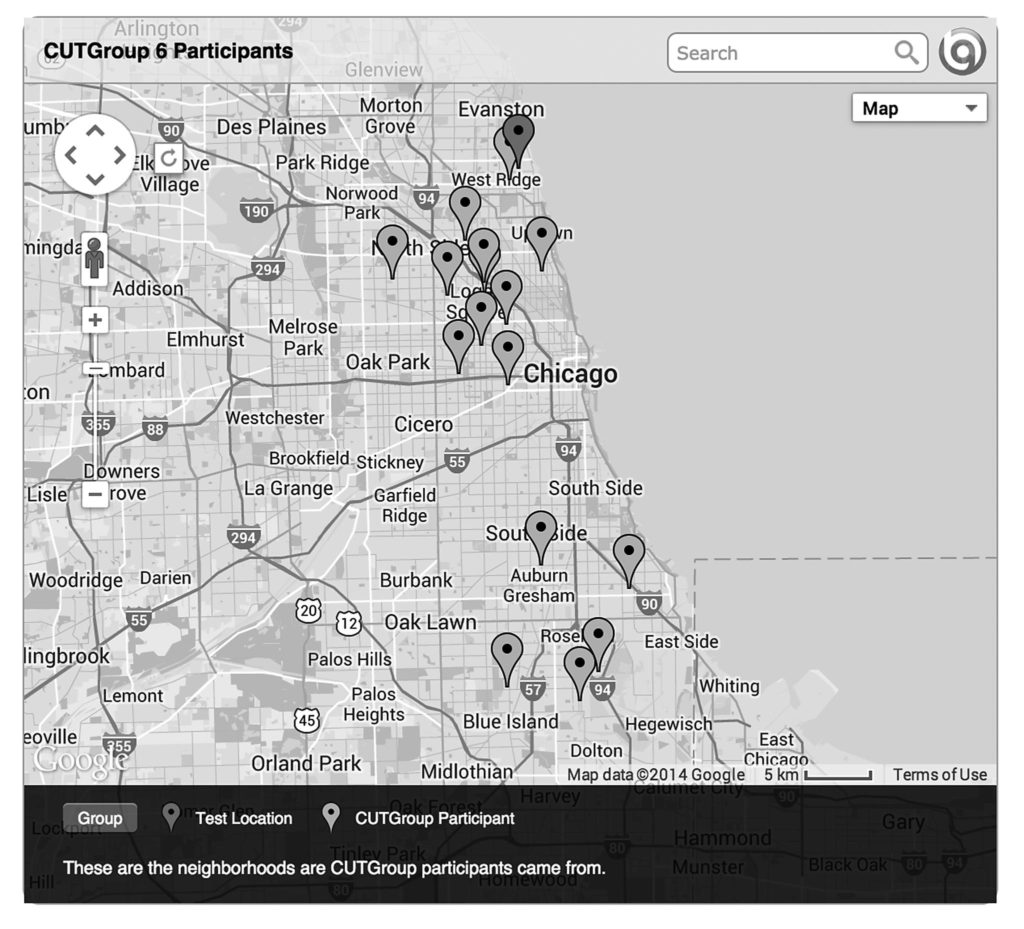
#6 – OpenStreetMap Editor
For our sixth test, we focused on the editor feature of OpenStreetMap.org. This in-person test took place at the Chicago Public Library’s Rogers Park Branch at 6907 N. Clark Street in the Rogers Park neighborhood.
OpenStreetMap (OSM) is a website that is built by a community of map- pers who contribute local knowledge and information to a map for everyone to use. Anyone can sign up, add information, and edit the map.
OSM is open data, and you are free to use it for any purpose as long as you credit OSM and its contributors. The main thing we tested was the ease of signing up and editing a map. This is of enormous interest to us at Smart Chicago, because we think that OSM is an opportunity for community mem- bers to describe their own streets, buildings, and assets with greater accuracy than anyone else. The fact that OSM runs millions of map experiences per day means that the more regular residents update OSM, the more communi- ties can put their best foot forward on the Web. The more comfortable people are in editing the map, the more accurately that communities can be shown on the map.
Sixteen testers provided their feedback regarding OSM, and we learned a lot. Not only about the functionality of the map editor, but also about peo- ple’s feelings on the concept of editing a map. Some testers liked the idea
of contributing knowledge for others to use, while other testers thought the concept of making live changes to a map was “scary” or “dangerous.” Here are a couple of telling comments we got:
- “I believe in power of people and having a significant contribution to these things. Gives a sense of community and add value in the sense of belonging” – Tester #5, kirehernan
- “I personally would but I would not want others to have the same access as I would due to the lack of restrictions.” – Tester #7, B
We also saw that the map scale posed challenges to the testers. Some became frustrated that when their search was not in the visible map area, they had to choose “Search Worldwide.”
When searching, testers sometimes received too many options that were irrelevant to what they were looking for, or they could not find their search term. Testers are interested in having a clearer way of searching for locations.
Fourteen testers (88%) said they liked the site, and 11 testers (69%) said they would use the map editor again. Here are some reasons why testers wanted to use OSM’s editor:
- Update outdated data
- Contribute to a neighborhood’s visibility
- Feel the need to customize or make a map more personal • Add information about safe pedestrian and bike paths

References
- Open Street Map. (n.d.) Retrieved from http://www.openstreetmap.org/#- map=5/51.500/-0.100
- Marziano, Sonja. (2014, January 22). CUTGroup #6: OpenStreetMap Editor. Retrieved from http://www.smartchicagocollaborative.org/cutgroup-6-openstreet- map-editor/
- Connect Chicago. (n.d.). Rogers Park Library. Retrieved from http://locations.weconnectchicago.org/location/rogers-park-library-6907-n-clark-street
- Open Street Map. (n.d.). Copyright and License. Retrieved from http://www.openstreetmap.org/copyright
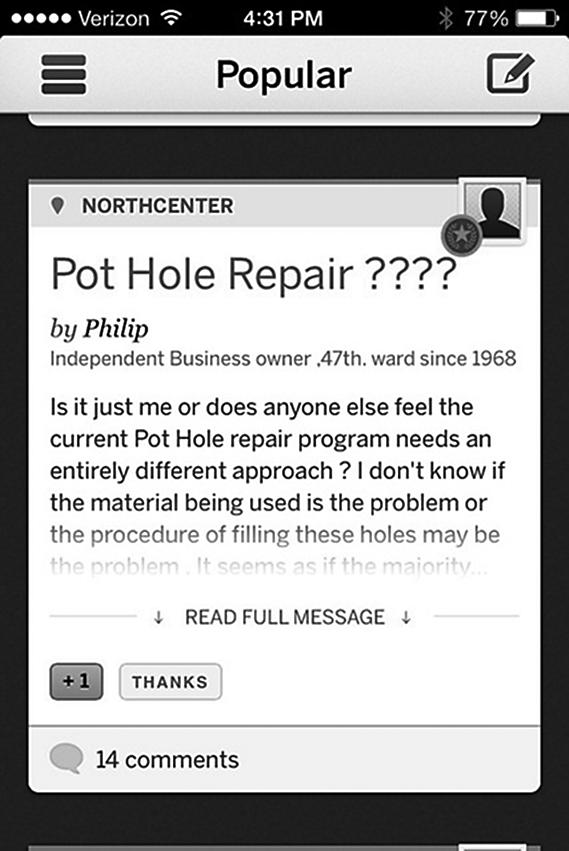
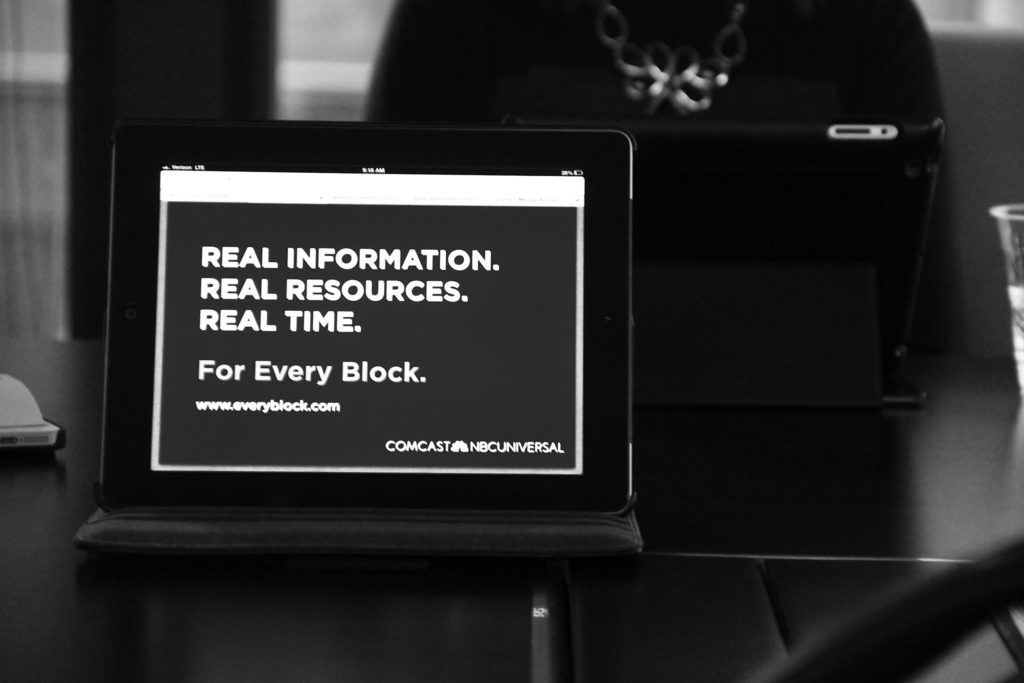
#7 – EveryBlock iPhone App
EveryBlock was coming back. The popular Chicago version of the neighbor- hood news and conversation website was relaunched in January 2014 by new owners, Comcast NBC Universal. They wanted to test their iPhone app—a vestige of the old site—to help them plan new features after their relaunch. I was part of the original team that launched EveryBlock in 2007 and had continued working in civic tech at Smart Chicago, so it was fun to get a chance to test a product I had worked on long ago but which still had relevance to me in civic tech.
This in-person test took place at the Chicago Public Library’s Mayfair Branch at 4400 W. Lawrence Avenue in the Mayfair neighborhood.
We sent out an email to 269 CUTGroup participants who said they had an iPhone as their primary or secondary device. We asked them if they would be willing to test a neighborhood app on February 10. We also asked some screening questions to gather extra information, and we chose our group of participants based on a diverse selection of answers.
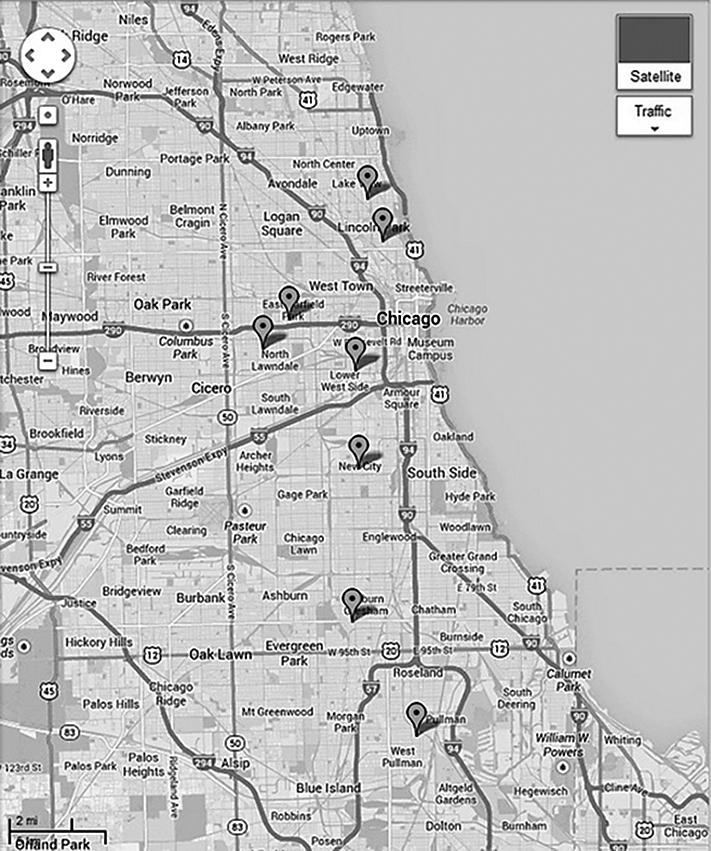
We had 12 testers who came from neighborhoods across Chicago including Albany Park, Hermosa, Edgewater, Uptown, Logan Square, Auburn Gresham, and more. The farthest a tester traveled from their home location was 15.3 miles.
This in-person test was the first opportunity we had for every tester to be paired with a proctor. In previous tests, some testers were paired with proc- tors, while others would answer questions about the website or app through an online form.
One thing we tested was the propensity of testers to want to post via the Ev- eryBlock mobile experience, and 83% of testers said they would. The majority of testers thought this was a convenient option, and they wanted to comment on things while they are happening. We noted that posting from mobile was a far more common activity than even a year ago, when the site was shut down.
The biggest takeaway from this test is that users were interested in features which would allow them to have an experience that matched their experience on the EveryBlock website.
References
- EveryBlock. (2013). Farewell, Neighbor. Retrieved from http://goodbye. everyblock.com/
- Connect Chicago. (n.d.). Mayfair Library. Retrieved from http://locations.weconnectchicago.org/location/mayfair-library-4400-w-lawrence-avenue
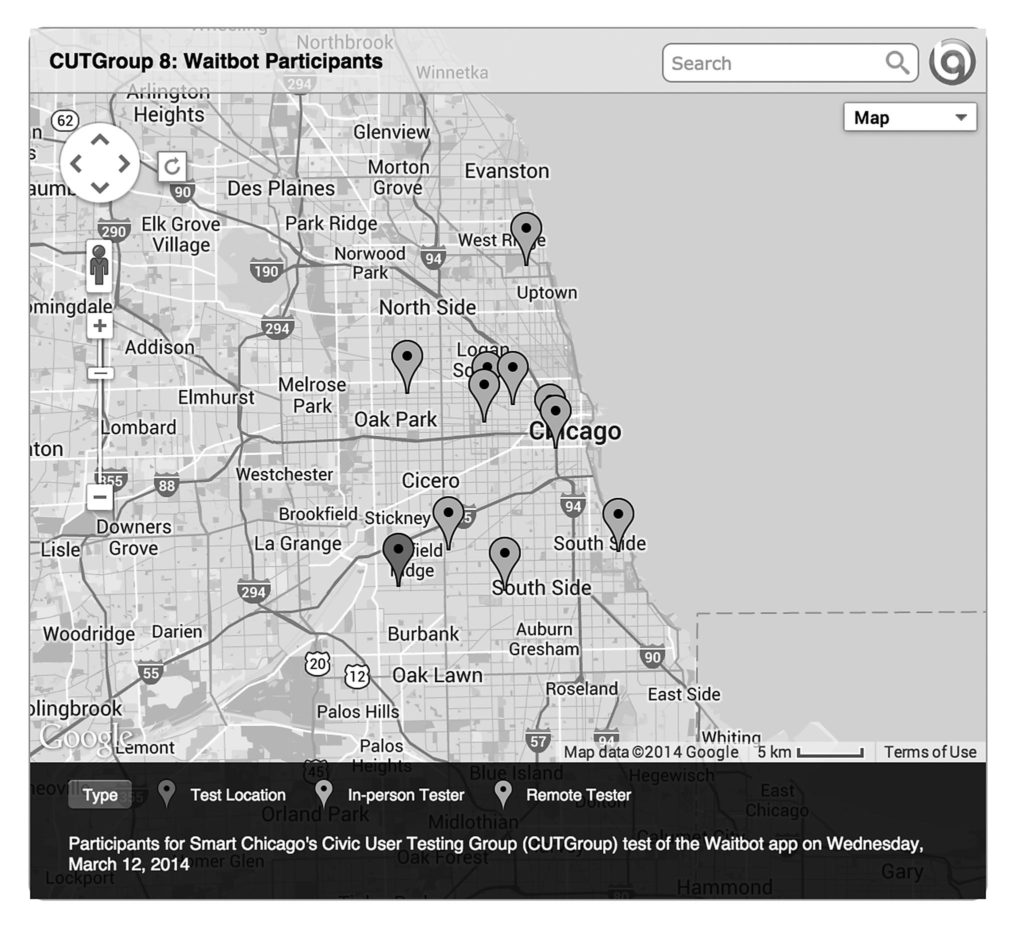
#8: Waitbot
For our eighth CUTGroup session, we tested the Waitbot app, where you
can find estimates for waiting times of all sorts of things, including transit, restaurants, airports, and more. This test had an in-person and a remote component to it. The in-person test took place at the Chicago Public Library’s Clearing Branch at 6423 W. 63rd Place in the Clearing neighborhood.
Through this test, we were interested in finding answers to these questions:
- What makes users download an app? Delete an app
- Do users want to use Waitbot on a daily basis? Why or why not?
- What features do users want?
- What other wait-related categories would users want to see?
- Do users want to share wait-time information on social media?
On March 5, we sent out an email to all of our 749 CUTGroup participants. We asked them if they would be willing to test a wait-time estimates app on March 12, 2014. We asked some screening questions to gather information, and we chose our group of participants based on a diverse selection of answers and also device types.
We were interested in having about 15 participants from different Chicago neighborhoods, but we only had 6 testers come to test in-person. A lot of testers could not come due to a combination of weather and distance, so we reached out to 4 more testers to do the test remotely.
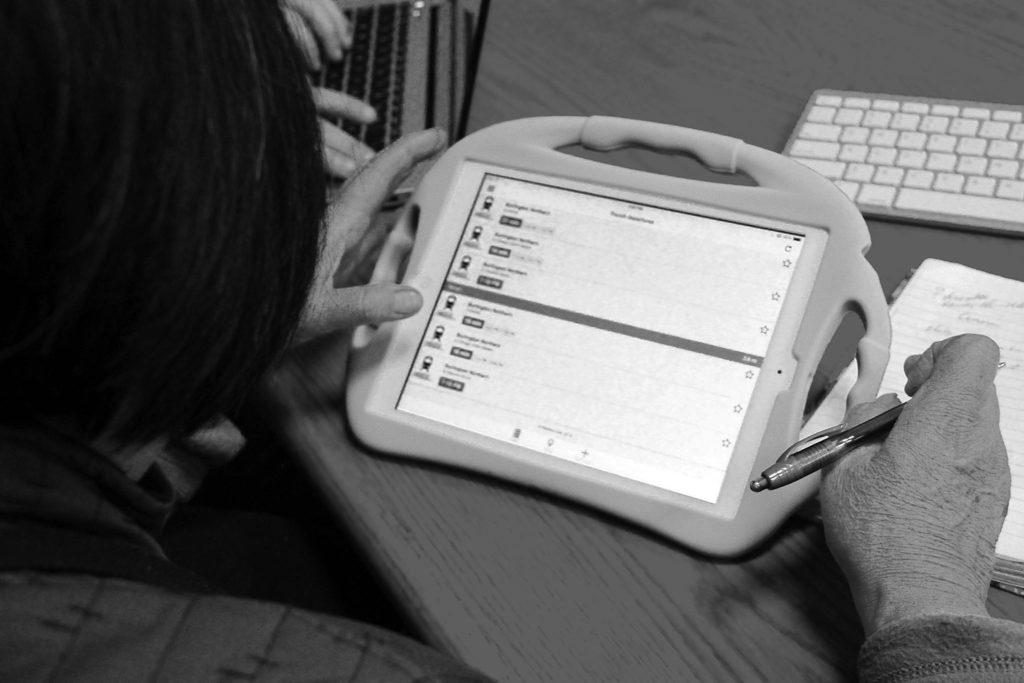
For the in-person test, proctors were able to work with testers one-on-one. Testers looked at the app on their own devices and provided feedback, while the proctors wrote down notes. After the test, we sent out additional, optional questions by email to see if testers were using the app and to see how they liked the app in their own neighborhood.
For the remote test, we asked testers to use the app on their own, and we provided questions to lead them through the test. In the end, we got great responses from both types of tests.
Most testers were not interested in sharing wait-time information on social media. One tester would share on Facebook only if it was automatically connected, while another tester said he would not do it unless there was an incentive. Only 3 out of 10 testers would share on social media.
When testing the Waitbot app, testers liked the transit page and the fact that it populated with nearby options. There was some confusion with col- or-coding, and testers wanted added features such as route display. However, testers overwhelmingly liked this page.
One tester, My eyes are dried out (#10), explains why he doesn’t like the Waitbot app in general, but thought that the transit page was the most useful:
“The Swiss army knife is useful and practical. Then the impostors ‘improved on it,’ making it bigger and more cluttered with useless features. Sometimes I feel app creators want to entice a large crown, instead of just perfecting one good thing.”
References
- Marziano, Sonja. (2014, March 12). CUTGroup #8: Waitbot. Retrieved from http://www.smartchicagocollaborative.org/cutgroup-8-waitbot/
- Waitbot. (2013). Retrieved from http://waitbot.com/
- Connect Chicago. (n.d.) Clearing Library. Retrieved from http://locations.weconnectchicago.org/location/clearing-library-6423-w-63rd-place
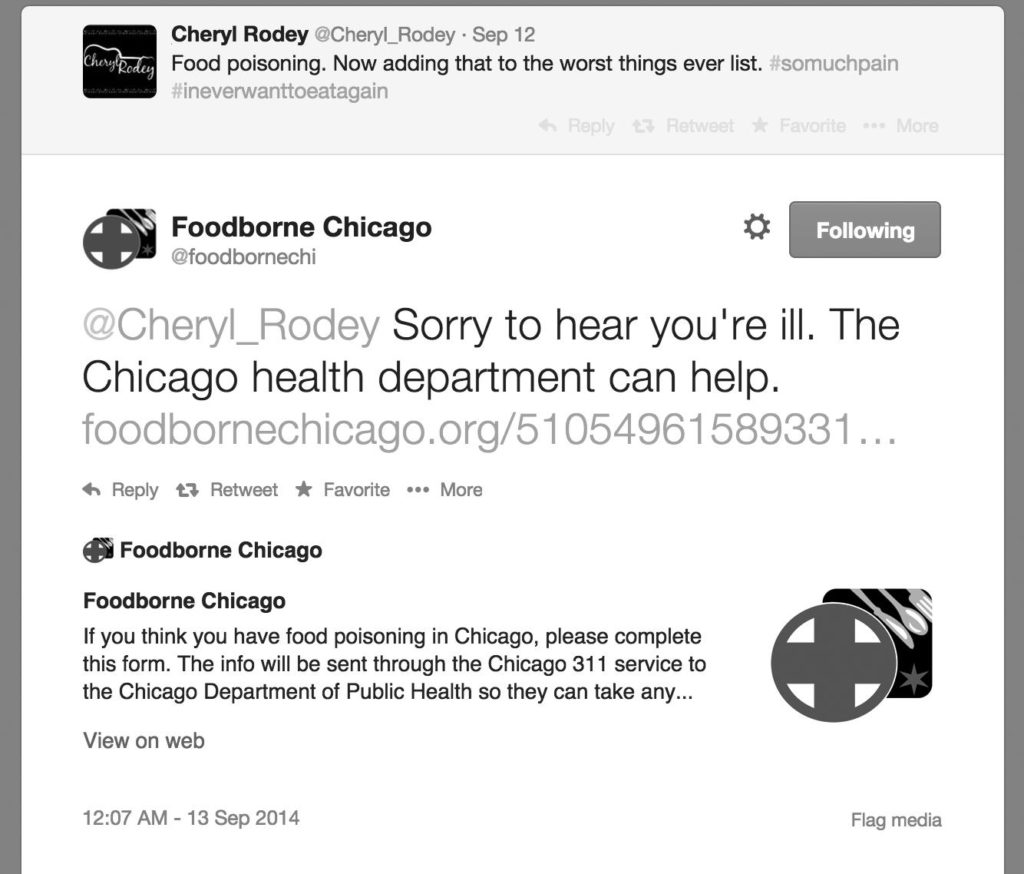
#9 – Foodborne Chicago
We really feel like we’re hitting our stride with the last test we want to cover in this book—a test for Foodborne Chicago, an app that searches Twitter for tweets related to food poisoning and helps users report these incidents to the Chicago Department of Public Health. Joe Olson, one of the creators of Foodborne, received a grant, administered through Smart Chicago and the Chicago Community Trust, to build better communication strategies to engage all Chicago residents.
Cory Nissen, a statistician who wrote the Twitter classification code for this project, mapped out Foodborne Chicago reports and showed that there was less of a response from the South Side of Chicago. That is to say, of all the people who publish a tweet that includes the phrase “food poisoning” from inside the city of Chicago, those on the South Side are less likely to click on Foodborne’s prompt and complete a report. Through this test, we were interested in learning more about how people use Twitter, and whether there were differences among communities and networks.
This was also the test where we had the largest number of direct insights that could be turned into features and Github issues to improve the site. We made a number of changes, and the results are promising.
Here is a list of questions we wanted to answer through this test:
- How do users feel about responding to a random tweet?
- Does the form require too much information?
- Would users feel better or worse if there was more Chicago Department of Public Health or 311 visibility?
- Why might residents on the South Side of Chicago not respond as often as residents from other Chicago neighborhoods?
On April 9, we sent out an email to all of our 754 CUTGroup participants. We asked them if they would be willing to test an app on April 14, 2014, that helps report food poisoning incidents to the Chicago Department of Public Health via 311. We asked potential testers some screening questions and then chose a group of participants who were Twitter users, and who were primarily from South Side neighborhoods. This in-person test took place at the Chicago Public Library’s Blackstone Library at 4904 S. Lake Park Avenue in the Kenwood neighborhood.
We did a focus group-style test with three 30-45 minute sessions, with 5 people in each session. First, we had testers fill out a survey, prepping them to form their own opinions before the group discussion. Next, we asked testers to discuss their answers, and then we asked additional questions as part of a group discussion. We had some very interesting in-depth conversations, not only about Foodborne Chicago, but also about Twitter and social media use in general.
We learned that Twitter is used as a private communications network for the majority of our testers, even though their tweets are public. Twitter users tend to connect with people they know or who are in their networks. Most testers were not sure about responding to people they did not know, because strangers usually tended to be spammers.
Foodborne prompts people on Twitter to fill out a web-based complaint form that routes to 311. For our user test, we wondered whether the 311 complaint form had too many fields. Would users want to fill it out? We learned that users had little issue with the form, and they liked that it was simple and did not require too much information. The tester Bakunin thought that it was his “civic duty” to fill out the form to make sure others did not get sick. While we were not asking too much information on the form, testers still had questions about our privacy policy and the process.
Overall, testers were interested in seeing a stronger connection to the City of Chicago, the Chicago Department of Public Health and 311. Testers thought that seeing relevant logos on the website would emphasize these official, municipal connections. Testers also indicated that language about “The City” on the form was not descriptive, and they wanted more information about the process.
Based on feedback from the test, we immediately changed our tweet language to include compassion and an official component—the Chicago Department of Public Health. We also added a Twitter card (a way to attach rich photos, videos and media to tweets) in order to provide more detail about information being sent through the Chicago 311 service. Twitter cards weren’t available to small publishers like us when we first launched Foodborne, so that is a lesson in itself— we should be on top of new features and implement them as soon as we can.
We changed the URL to https://www.foodbornechicago.org/ from https:// foodborne.smartchicagoapps.org. People said they would be more likely to click that link.
Testers felt more comfortable the more they knew that there would be an official response. We changed the header information to include the Chicago Department of Public Health name and logo.
Testers also felt more comfortable with the form and the process of providing their information after reading the Q&A page. The final step is figuring out ways to be part of more people’s networks so that they feel comfortable clicking the link in a Foodborne tweet and submitting the form to report on their food poisoning.
References
- Marziano, Sonja. (2014, June 18). CUTGroup #9 – Foodborne Chicago. Retrieved from http://www.smartchicagocollaborative.org/cutgroup-9-foodborne-chicago/
- Knight Foundation. (n.d.). Chicago Food: Smart Chicago Collaborative. Retrieved from http://www.knightfoundation.org/grants/201347651/
- City of Chicago. (n.d.) Department of Public Health. Retrieved from http://www. cityofchicago.org/city/en/depts/cdph.html
- Nissen, Cory. (2013, November 25). Mapping Foodborne Chicago Reports. Retrieved from http://blog.corynissen.com/2013/11/mapping-foodborne-chicago-reports.html
- Foodborne. (n.d.). Add Twitter Card support. Retrieved from https://github.com/smartchicago/foodborne/issues/49
- Foodborne. (n.d.). Change header information to include Chicago Department of Public Health. https://github.com/smartchicago/foodborne/issues/54
- Twitter Cards. (n.d) Retrieved from https://dev.twitter.com/cards/overview